
Dashboard
Dashboard
After a successful login, the enterprise dashboard is displayed.
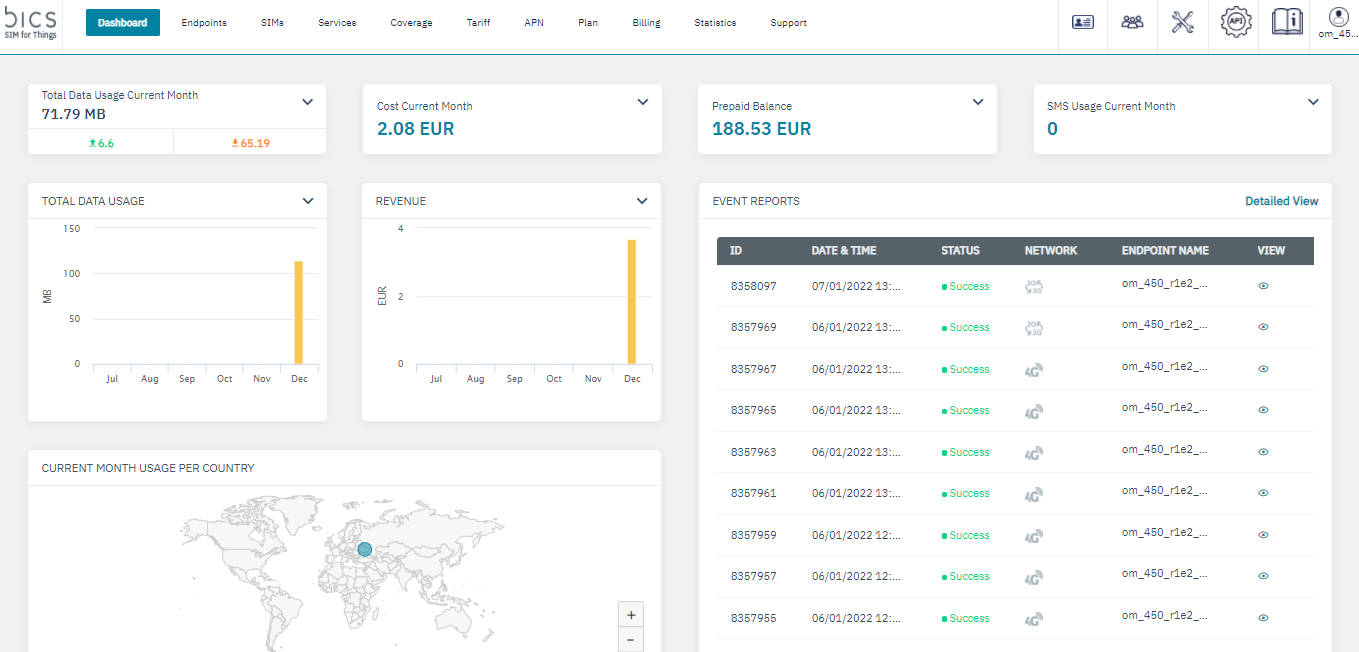
Figure 1 Dashboard
Current Month Statistics - On the Dashboard, you can view the following current month details.
Total Data Usage Current Month - Indicates the total data consumed by the Enterprise for the current month. Includes data consumed for both uplink and downlink.
Cost Current Month - Indicates the total charges for the current month based on the usage and other charges.
Monthly Limit - Indicates the monthly credit limit of the enterprise. Depending on the credit limit set by the parent, the monthly credit limit varies. Note: Monthly limit is applicable only for postpaid customers.
Prepaid Balance – Indicates the prepaid balance available for the enterprise. Note: Prepaid balance is applicable only for prepaid customers.
SMS Usage Current Month – Indicates the total SMS count for the current month.
Revenue – Indicates the total revenue generated by the enterprise for the current month. Note: By default, Revenue detail is not displayed. You can view Revenue detail by clicking
displayed next to the parameter.
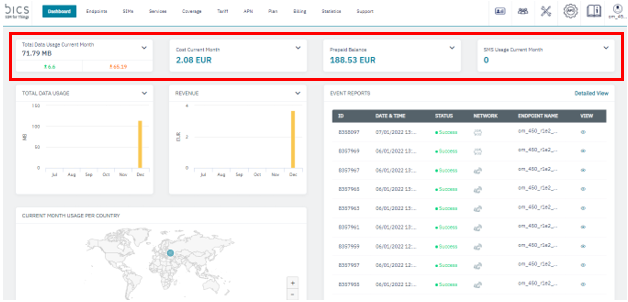
Figure 2 Current Month Statistics
Other Statistics
In addition to the current month statistics, you can view the details of the following parameters on the Dashboard.
Total Data Usage Current Month- Indicates the month-wise data usage of the Enterprise for the last 6 months. This includes the data consumed for both uplink and downlink.
Revenue - Indicates the month-wise revenue generated for the last 6 months.
SIM Resource - Indicates the current count of SIMs active, suspended, generated, and ready to activate SIMs.
Top 5 endpoints - Based on the current month usage and charges, the top 5 endpoints under the enterprise are displayed.
Cost - Indicates the month-wise cost incurred for the last 6 months.
SMS Usage – Indicates the month-wise SMS count for the last 6 months. Note: By default, Data usage and Revenue graphs are displayed. You can view other graphs by clicking
displayed next to the parameter
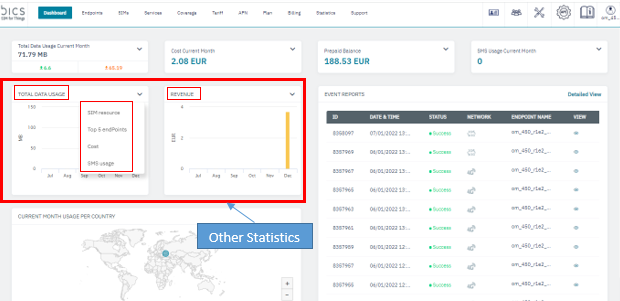
Figure 3 Other Statistics
Current Month Usage Per Country
On the Dashboard, you can view the current month data usage for each country on the map view.
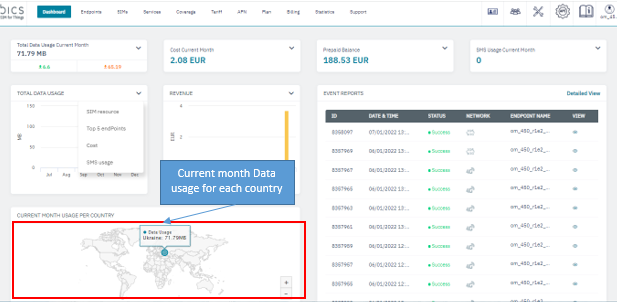
Figure 4 Country wise usage
Country name and data consumed are displayed
Click
to zoom in and click
to zoom out of the map view.