
SIM's with usage by RAT
SIM's with Usage by RAT
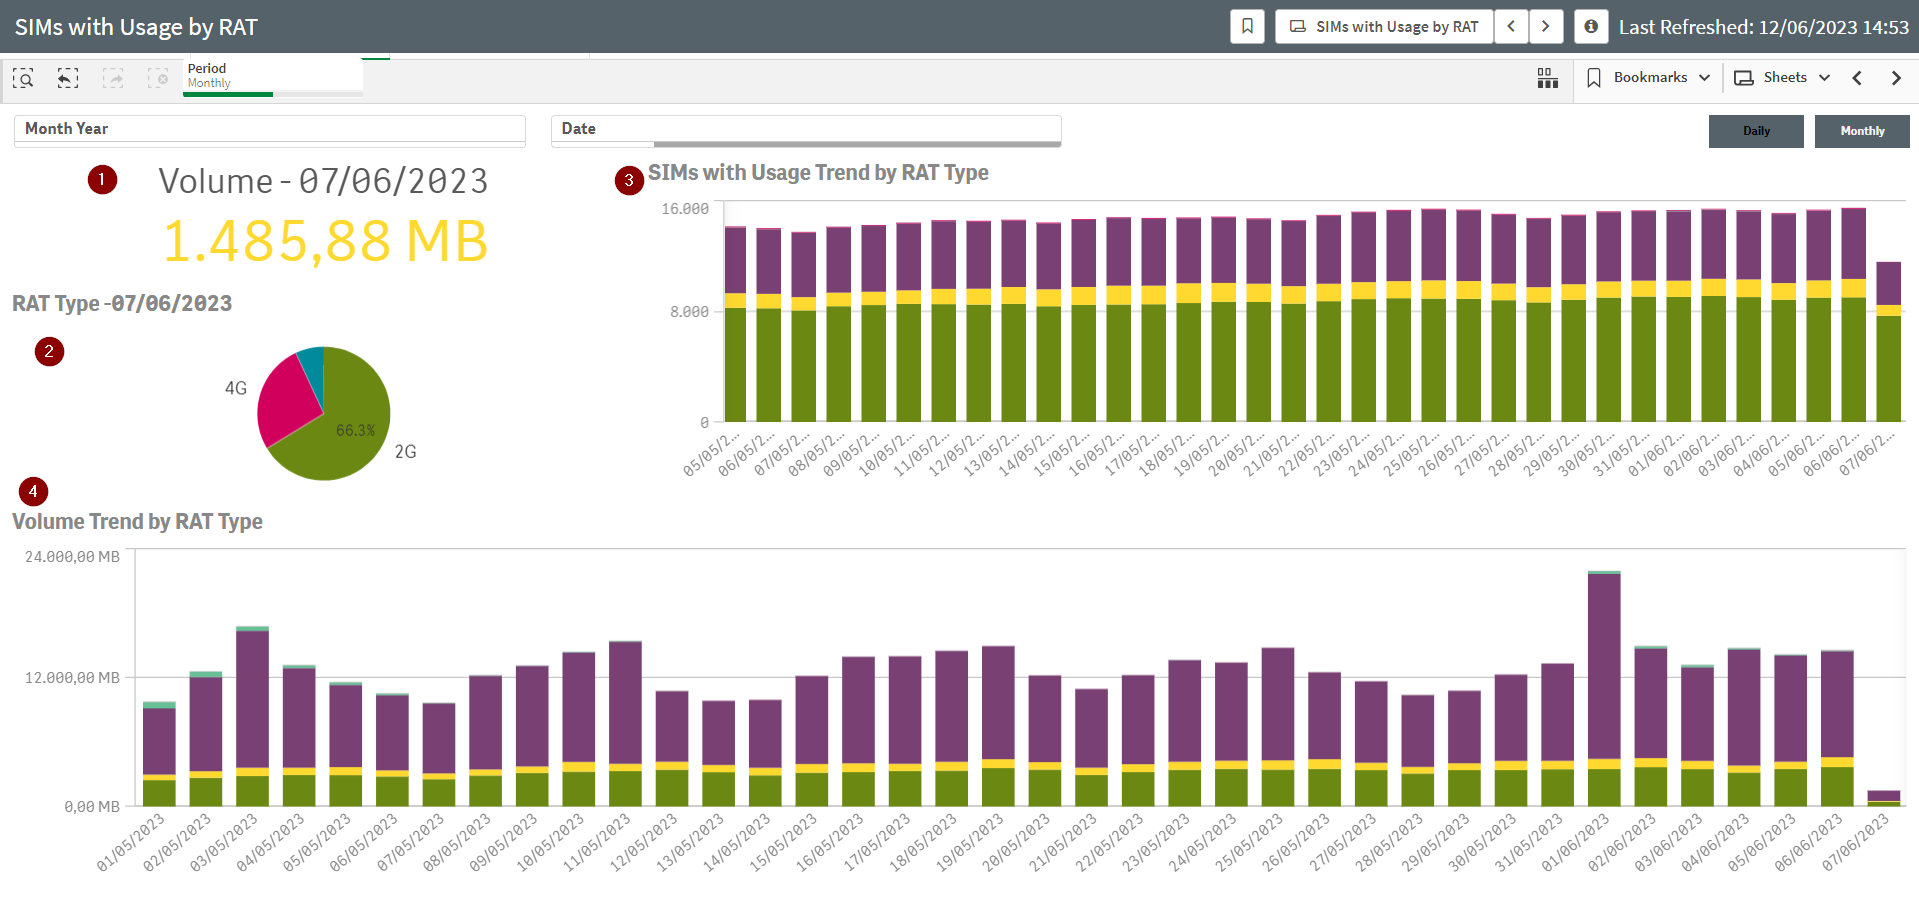
KPIs are presented on the top,
1 - Volume of the last available/selected period
Chart in the middle,
2 - Pie chart with % distribution of SIMs with Usage on the last available/selected periods by RAT Type
3 - SIMs with Usage over the last available/selected periods by RAT Type
4 - Volume over the last available/selected periods by RAT Type

There are multiple filters available,
Month Year
Date
RAT Type
And
Granularity can be switched between Daily and Monthly